P&L Reports
Profit & loss at a glance
Comprehensive profit & loss reporting per property and portfolio-wide. Revenue breakdown by source, expense categorization from scanned invoices, depreciation, financing costs, and net profit calculation. Exportable to PDF, CSV, and DATEV format.
Try It Free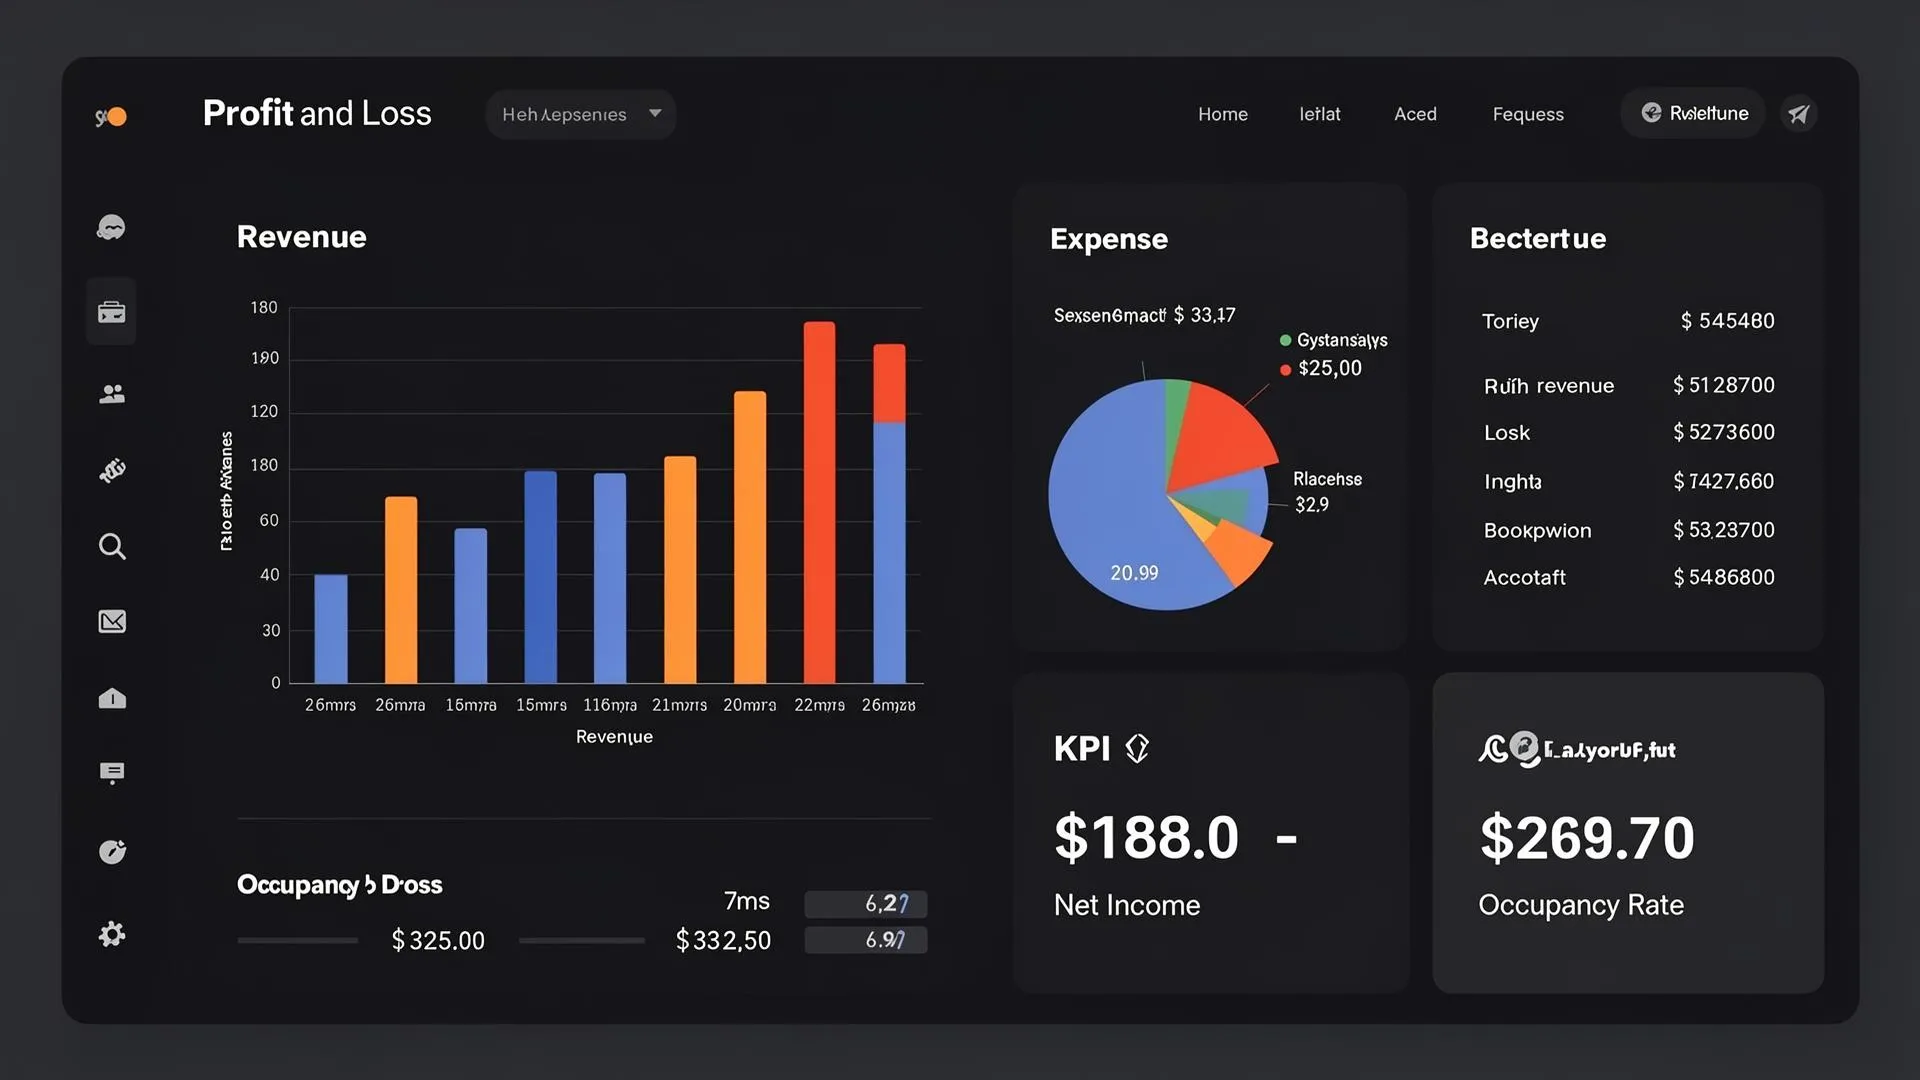
What you gain
Every feature creates value for both sides - you and your guests.
For the Host
Know exactly what each property earns
- Per-property P&L shows true profitability - some properties look great by revenue but lose money after expenses.
- Commission tracking reveals how much each booking channel actually costs you.
- Expense categorization from AI invoice scanning makes the P&L accurate without manual data entry.
- Depreciation and financing costs give the complete picture - not just operating profit, but true net profit including capital costs.
- DATEV export saves your accountant hours - clean, structured data they can import directly.
For the Guest
Financially stable, well-managed properties
- When a host understands their finances, they reinvest in property quality and guest experience.
- Transparent financial management reduces the risk of sudden price increases or operational failures.
How it works
A step-by-step look at the experience.
The P&L report pulls revenue from bookings (accommodation, cleaning fees, tourist tax pass-through) and expenses from scanned invoices.
Revenue is broken down by source: PMS bookings, direct bookings, manual entries. Each shows gross, commissions, and net.
Expenses are categorized from invoice scanning: cleaning, maintenance, furnishing, utilities, insurance, management fees, marketing, and other.
Depreciation is calculated automatically from unit assets (furniture, appliances, renovations) with their configured depreciation methods.
Financing costs (bank loan interest) are pulled from the unit's loan tracker.
Net profit: Revenue - Commissions - Expenses - Depreciation - Financing = Net Profit.
Filter by property, date range, quarter, or year. Compare periods year-over-year.
Export to PDF (visual report), CSV (raw data), or DATEV format (German accounting software).
Feature deep dive
Detailed look at every capability within P&L Reports.
P&L Dashboard
Interactive report showing: gross revenue, platform commissions, net revenue, operating expenses (by category), depreciation, financing costs, and net profit. Filter by property, date range, or quarter.
Revenue Breakdown
Revenue split by: accommodation income (7% VAT), cleaning income (19% VAT), tourist tax (pass-through), extras. Each line shows gross, VAT, and net. Year-over-year comparison available.
Expense Analysis
Expenses by category: cleaning, maintenance, furnishing, utilities, insurance, management fees. Per-property and portfolio-wide. Trend lines show cost development over time.
VAT Overview
Automatic VAT calculation: 7% accommodation VAT payable, input VAT refundable from invoices, and net VAT liability/refund. Bed tax (transit item) tracked separately.
Export Options
Export P&L to PDF (visual report), CSV (raw data), DATEV format (accounting software), or Anlageverzeichnis (asset register for tax filing). All exports respect the current filter selection.