Performance Insights
Data-driven decisions
AI-generated reports highlighting trends, anomalies, and opportunities across your portfolio. Identify underperforming properties, rising costs, occupancy patterns, and revenue optimization opportunities - all in natural language summaries.
Try It Free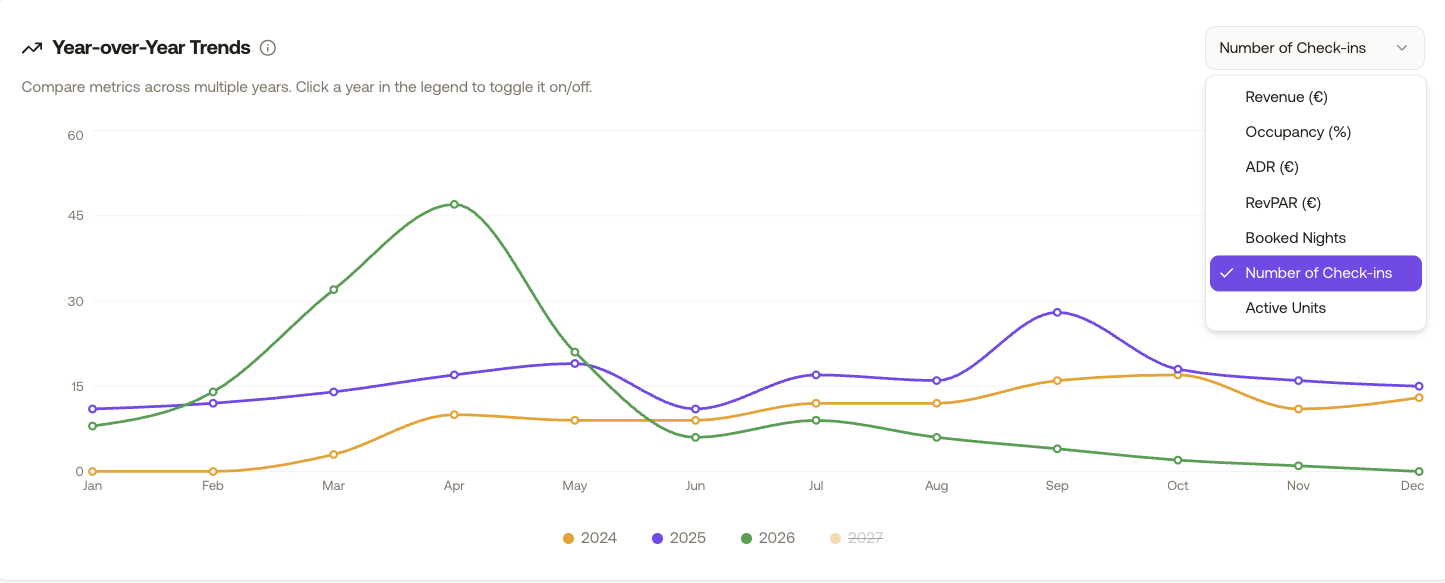
What you gain
Every feature creates value for both sides - you and your guests.
For the Host
Understand your portfolio at a glance
For the Guest
A host who continually improves
How it works
A step-by-step look at the experience.
Ask natural language questions: "What was my occupancy in Berlin last month?" - AI queries your data and returns the answer with context.
Automatic trend detection: AI identifies patterns in occupancy, revenue, and expenses across your portfolio.
Anomaly alerts: unusual spikes in expenses, sudden drops in bookings, or revenue deviations are flagged.
Property benchmarking: compare performance across units - which properties earn more per night, which have higher costs.
Year-over-year comparison: see how this month/quarter/year compares to the same period last year.
Revenue optimization suggestions: AI recommends pricing adjustments, channel shifts, or operational changes based on your data.
Feature deep dive
Detailed look at every capability within Performance Insights.
Natural Language Queries
Type a question about your portfolio and AI returns the answer: "What was my best-performing property last quarter?" → AI analyzes bookings, revenue, and expenses and returns a ranked summary.
Trend Dashboard
Visual charts showing occupancy rate, ADR (average daily rate), RevPAR, revenue, and expenses over time. Filter by property, city, or portfolio-wide.
Anomaly Alerts
AI continuously monitors your data for anomalies: unusual expense spikes, booking drops, or revenue deviations. Alerts appear in your notification feed with explanation and suggested action.
Property Benchmarking
Compare properties side-by-side: occupancy, ADR, RevPAR, net profit margin, guest rating, response time. Identify top performers and underperformers.
Year-over-Year
Select any time period and compare to the same period in previous years. See growth in revenue, occupancy changes, and cost development.